Debugging
This content relates to a deprecated version of Mbed
Mbed 2 is now deprecated. For the latest version please see the Mbed OS documentation.
This guide examines some techniques for generating debug information to help find and fix problems with your code, and how to deal with problems that are being reported.
If you're looking for a visual debugger like uVision or Eclipse that allows you to step through code, read Offline development and debugging with mbed in the mbed Docs. We also have an article on debugging crashed (hard faulted) devices.
Compile time errors
Compile time errors and warnings are caused by incorrect syntax, or misuse of variables or functions. An error will prevent the compile process from completing (and therefore no binary file will be created). A warning will not prevent the binary from being created, but you should still review the warning as it may mean that your code is not going to do what you had intended.
Common errors are:
- Missing declarations of variables and interfaces, leading to "Identifier undefined" errors.
- Missing semicolons ";". Semicolons are required at the end of each line.
- Missing quotes of brackets, "",(),[] or {}. These are used in pairs to contain various types of statement. The compiler will report an error if you have not used them in correct pairings.
Always tackle the very first error that is reported, as later errors might be as a result of the first one, and will disappear when the first one is corrected.
If you are seeing a compile time error or warning that you do not understand, Google will usually find explanations of the error message, or post to the mbed Forum
Runtime errors
Runtime errors are caused either by code that is correct but tries to do something that is invalid, or when malfunctioning hardware cannot be accessed.
The example below shows a PwmOut interface being configured on pin p20. The PwmOut interface is being correctly used, and so the code compiles without warning or error. When the code runs, it tries to create a PwmOut to pin p20. Because PwmOut is not available on pin p20, a run time error is triggered.
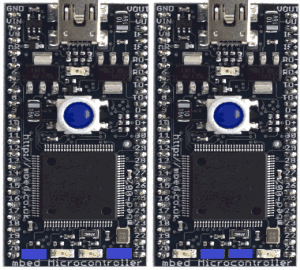
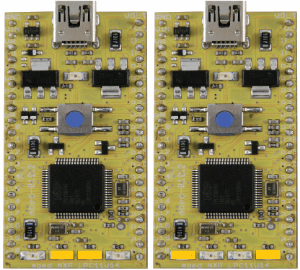
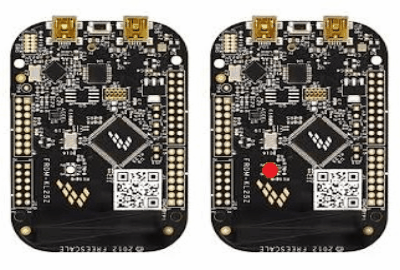
Lights of Death
When a run time error is encountered, the board will flash it's LED's in a distinctive pattern to let you know that an error has occured and that the program has stopped running.
| LPC1768 | LPC11U24 | FRDM-KL25Z |
|---|---|---|
 |  |  |
When the program below starts a run time error is caused, leading to the siren lights.
Example of a run time error
#include "mbed.h"

PwmOut led(p20);
int main() {
    while(1) {
        for(float p = 0.0f; p < 1.0f; p += 0.1f) {
            led = p;
            wait(0.1);
        }
    }
}
Runtime bugs
When your code compiles and runs without error and warning, it still may not behave as you'd expect or hope. This is usually because the code you have written is correct, but not what you had intended. This is usually caused by the program flowing in a way you'd not intended because of a logical mistake or values being computed incorrectly due to an incorrect expression.
Fortunately there are some useful techniques that you can apply to help find and correct these bugs:
- Flash LEDs - Turn LEDs on and off, also to indicate where the program is.
- Debug messages - Print messages and variable values over the serial port.
Debug messaging
The mbed libraries contain some features for reporting runtime errors.
The main things to use are:
printf()- Print a formatted message to the USB Serial Port (stdout default)error()- Print a formatted message to the USB Serial Port, then die with "Siren Lights"
Debug to a serial console
The debug functions mentioned above all cause debug information to be printed over the USB serial port. This is generally the main way to debug running programs on your mbed microcontroller.
For more information on using the USB Serial port, see the SerialPC page.
"Example showing serial terminal debug messages
#include "mbed.h"

DigitalIn button(p21);
AnalogIn pot(p20);

int main() {
    while(pot > 0.0) {
        printf("Pot value = %f", pot.read());
        wait(0.1);
    }
    error("Loop unexpectedly terminated");
}
Debugging program flow control
Most programs of a even a low level of sophistication will have loops, if-else and case statements, all of which make a decision based on some logic or arithmetic. If your program is not flowing as expected, you can used LEDs and print data values to determine why.
Below is an example of how you might use LEDs to determine the flow of your program. In this example, the status of the button is being echoed to LED2, so it is clear to see if the program sees the button as being pressed. LED3 is set by the if-else statement, so it is clear how the program control flow is operating.
#include "mbed.h"

DigitalIn button(p19);
AnalogIn pot(p20);
PwmOut led1(LED1);
DigitalOut led3(LED3); // use for debug

int main() {
    while(1) {
        if (button && (pot < 0.7)) {
            led3 = 0;
            led1 = pot;
        } else {
            led3 = 1;
            led1 = 0.0;
        }
    }
}
Debugging incorrect data values
It is often useful to find out the values of variables in your program at a given time. The example is the same as the one above, except that we are are now using the serial port to print out the value of the AnalogIn. You might need to use this method if you are using a data value to determine the program flow.
Example
#include "mbed.h"

DigitalIn button(p19);
AnalogIn pot(p20);
PwmOut led1(LED1);

int main() {
    while(1) {
        printf("Value of pot is %.3f\n", pot.read());
        wait (0.1);
        if (button && (pot < 0.7)) {
            led1 = pot;
        } else {
            led1 = 0.0;
        }
    }
}
Where Next
All the different techniques mentionned previously are sometimes inefficient and have strong disadvantages:
- Delays are introduced in the code. So if a piece of code is time dependent, it can change the original behaviour of a program
- It slows down considerably the execution
- It is very ad hoc. Code is temporarily added, to be removed as soon as the bug is solved. For the next bug, similar code is added ...
Try out the mbed CMSIS-DAP interface with Keil MDK, if you need full debug capabilities:
- set breakpoints to stop the program at some event or at a specified instruction to examine the current state
- step by step execute a program to track the control flow
- check variables values
- inspect and modify memory contents